Intel Burn Test, Q6600, and Bizarro Land

Captain Picard

Weaksauce
Joined
Aug 28, 2005
Messages
120
Greetings,

A friend sold me his old Q6600 as an upgrade from my valliantly struggling E2180. I had that little dualie OCed to 3.1GHz, but some games still had framerate dips in high action scenes which didn't bode well for future game performance. Anyway, back to the Q6600, I recently slapped a Corsair H50 cooler onto it, hoping to get a much cooler, quieter and higher OC than I could with the stock heatsink. Before the H50, I couldn't really use Intel Burn Test to verify stability of an OC, since the CPU temperature would level out at 97*C or higher. The CPU wouldn't throw an error, and the PC wouldn't crash, but there was no way I could safely use that program.

With the H50 and the stock fan running at variable speeds with PWM, my IBT temperatures finally leveled out in a reasonable range, and I could overclock with confidence. After a few days of testing various CPU clock and voltage combinations, I discovered that, due to an anomaly I've never seen discussed before, my Q6600 is somewhat of a dud for overclocking.

My friend DID inform me that without phase change cooling, he had trouble getting a nice overclock out of this Q6600. I bought the CPU from him knowing that it was possible I might not get a very nice OC out of it, but $75 for a quad was too good a deal to pass up, even if it's a poor overclocker.

Anyhow, right now I've got the CPU at 3GHz, (376 x 8), and 1.27500V in bios (stock is 1.20000). However, I cannot use voltages above 1.30000 in bios, or clocks much above 3GHz without crashes in games, or the before mentioned anomaly occurring in IBT.

Initally, I used the stock multiplier of 9, and set the memory FSB ratio 1:2 to figure out what the CPU's limit was without encountering FSB or memory limits. What would happen with IBT and voltages higher than 1.30000 in bios (which were required to successfully boot at clocks above 3.1GHz) is that each run would begin to show wide variances in the time required to finish, and subsequently the GFlops score for each run.

Normally, each run should produce scores that fall within a narrow range, assuming you are not running any other programs which use a significant amount of CPU cycles. For instance, currently when I run IBT, my GFlops score and time to finish over several runs might look like this:

Time: 68s 67s 66s 67s

GFlops: 39.9 40.0 40.05 40.0


What happens when I use voltages above 1.30000 (again, necessary for stable CPU clocks @ 3.1HGz or higher), is that the variance between runs will go something like this:

Time: 64s 87s 95s 109s 83s

GFlops: 41.5 32.5 29.4 27.8 33.7


Note: these numbers are estimates based on what I've seen, they may not be 100% accurate, but they DO accurately describe the anomaly.

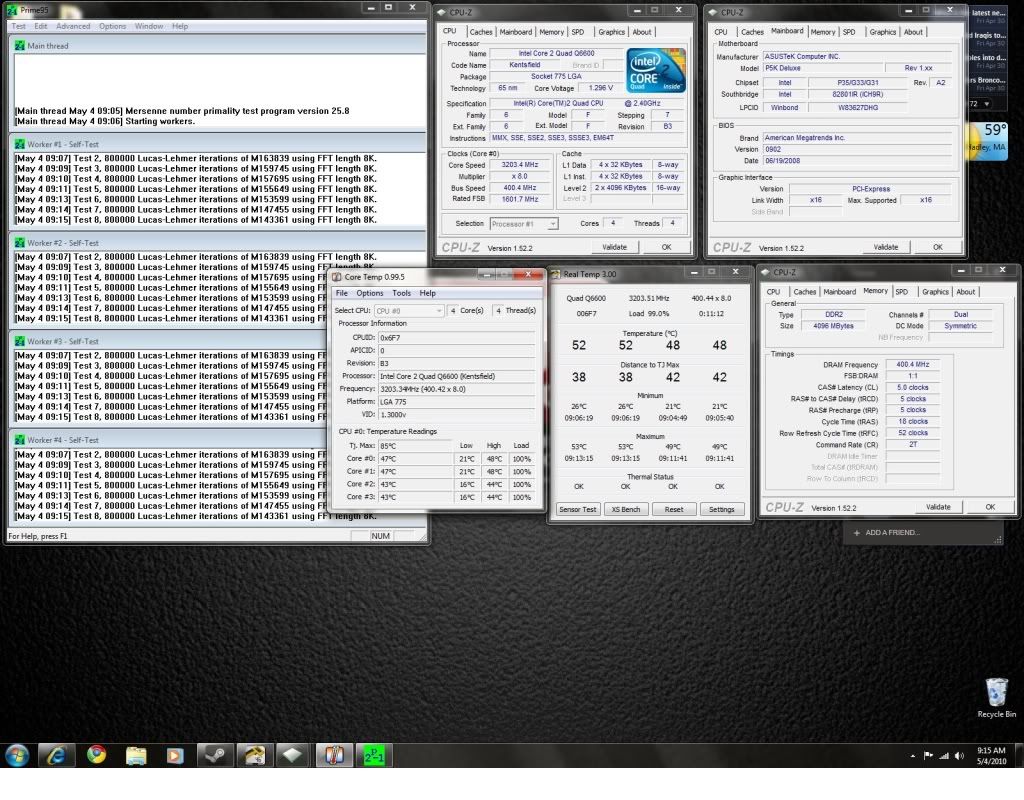
When these variances show up, IBT doesn't crash or produce an incorrect result at the end of the run, unless I happen to be using too little voltage for a CPU clock to be otherwise "stable". However, what DOES happen when these variances occur is that CPU cores 0 and 1 (CPU die 1, if I'm not mistaken) will suddenly drop in temperature by ~10*C, and remain that much lower than cores 2 and 3 for the remainder of each run. When C1E, and the gigabyte thermal monitor 2 are enabled in bios, CPUz reports that the CPU multiplier drops to 6, and the CPU is now running at 6 x FSB. At the end of each IBT run, or after I've halted the program, the CPU multiplier switches back to 9.

However, the anomaly persists EVEN WHEN C1E and TM2 are disabled in bios (along with anything else that might result in a dynamic VID and CPU clock, which the user is able to toggle). CPU-z does not report the CPU multipler and speed reducing, but the temperature drop and score variance persist.

I'm very sorry that this is such a wall of text, but I felt it was important to put this problem in as much context as I could muster. My question is, has anyone ever heard or seen of such an issue, and what do you believe the cause might be?
 
I had issues overclocking my q6600 over 3.2Ghz, then picked up the Gigabyte p45 board pretty cheap and now got it up to 3.6Ghz. It does get toasty compared to my AMD machines, so I threw an H50 on it and it's much better, that is one bad-ass cooling system! What stepping is it? G0 or B3? The G0's tend to have OC's in excess of 3.4Ghz+ while the B3's typically top out around 3.0-3.2Ghz.
 
I had issues overclocking my q6600 over 3.2Ghz, then picked up the Gigabyte p45 board pretty cheap and now got it up to 3.6Ghz. It does get toasty compared to my AMD machines, so I threw an H50 on it and it's much better, that is one bad-ass cooling system! What stepping is it? G0 or B3? The G0's tend to have OC's in excess of 3.4Ghz+ while the B3's typically top out around 3.0-3.2Ghz.

My q6600 is a G0 stepping, though you wouldn't really be able to tell by the measly 600MHz OC it's maxed out at. My friend suspects that if I were to get a P45 board, I could probably get a better OC. He may be right, but I think I'd rather put that money toward a new GPU or monitor.

What's really bugging me is the nature of the issue I'm having with IBT and voltages above 1.30000 in bios.
 
Basically, what I was saying is that it may just be the board making the Q6600 act all wacky. Also I use about 1.35 volts for 3.6Ghz, with the H50 I don't really worry about burning it out.
 
The issue is that I basically can't use voltages above 1.30000 in bios, regardless of what the CPU clock is. Perhaps that's due to the board I'm using, perhaps it's due to something else. The fact that IBT shows such anomalous results with higher voltages makes me believe that the CPU isn't really stable, even though the result at the end of each IBT run is the correct number.
 
for shits and giggles take out two sticks of ram.

also when your running ibt what temps are you seeing?

sounds like your h50 isnt installed properly and the cpu is scaling down to stop from burning up
 
I've tried taking 2 sticks of ram out, and the CPU tops out at around 75*C in IBT, so I've definitely got some breathing room temperature wise. Idle temps are 44*C, and the temperature distribution is very close across all cores. Core temp reports 43,44,44,44 at the moment.
 
Jean Luc, it's the P35 board and the 4 sticks of ram that are causing the problems. Like has already been discussed, a P45 board will probably help you but the investment is probably not worth it for you.
 
Why would 4 sticks of RAM be holding back the CPU clock? Why would 4 sticks of RAM have anything to do with that anomaly that occurs in IBT when the CPU voltage is 1.3V or higher? I don't mean to come off as confrontational, but I don't understand why that would be.
 
Last edited:
Why would 4 sticks of RAM be holding back the CPU clock? Why would 4 sticks of RAM have anything to do with that anomaly that occurs in IBT when the CPU voltage is 1.3V or higher? I don't mean to come off as confrontational, but I don't understand why that would be.

It's a very well known issue with P35 and even P45 boards that 4 sticks of ram causes inherent instability. The memory controller is just not that well designed for them. Memory instability can cause corruption and rounding errors in CPU calculations. That's why a common thing for 775 overclocks is to bump up the memory controller voltage (Memory Controller Hub - MCH voltage).

I don't have much experience with P35 boards so I don't know why you are encountering an issue over 1.3V. It maybe board specific or CPU specific. Try turning on load line calibration. Perhaps your vdroop is drooping too much over 1.3V
 
Unfortunately I don't have control of load line calibration in the bios on this board. The v-droop that comes with the board is the v-droop that I'm stuck with.
 
I see that your using Windows Vista, try this,

"Disabling" SpeedStep in Windows Vista/Seven*
*As of Seven RC1, the steps provided below are the same, however the windows do look slightly different.

Go to your control panel and open "Power Options"
80273838bu2.jpg


Next, regardless of which powerplan your on(though I recommend "High performance" for a desktop PC) hit "Change plan settings"
15347600ai6.jpg


Hit "Change advanced power settings"
88474535nc6.jpg


This will open the advanced options(go figure :bleh:), scroll down to the "Processor power management"
51712779yq9.jpg


Open and change "Minimum processor state" and "Maximum processor state" both to 100%
89300213kp3.jpg


Hit Apply and Okay to everything and your done!

Note: I doubt it will fix your issue, but who knows! Worth a try
 
I just checked out the advanced settings tab, and the min and max processor states. Both were already set to 100%, but as you said, it was worth a look.
 
Yes, I've tried voltages between and including 1.3 and 1.42500 volts. Anything that's 1.3v or above results in that strange issue with IBT.
 
What are your results with Prime95 Small FFT and Blend tests?

I've been hesitant to use P95 to verify stability, since it was my understanding that if you have issues with IBT, then the system isn't stable. There's definitely something strange going on, which most likely indicates that the system isn't actually stable.
 
Disable C1E and EIST

If that doesn't work, make sure your memory is running at 1:1 and then try loosening your ram timings.


I could get my Q6600 to 4.0 Ghz on air..........
 
Disable C1E and EIST

If that doesn't work, make sure your memory is running at 1:1 and then try loosening your ram timings.


I could get my Q6600 to 4.0 Ghz on air..........

G0? I wish I had a G0!
 
To make a quick recap of the issue for everyone who may be just entering the thread, this is the situation:

1: IBT produces wide variances in test run time, but no calculation errors when voltage is set above 1.3V in bios.

2: One of the two pairs of cores (core 0 and 1) will drop in temperature by approximately 10*C at some point in each IBT run.

2: When the variances occur, the CPU clocks down to 6 x FSB if C1E, EIST, and TM2 are enabled in BIOS.

3: When the above are disabled in bios, the CPU does not clock down according to CPU-z, but the wide time variance anomaly and temperature variance between CPU dice still occurs.


None of these occur at stock speeds or voltages.

What bothers me is that perhaps the system may function normally in most cases, and I may rarely encounter program errors and crashes, but the fact that IBT is behaving so strangely leads me to believe there is a stability issue here.
 
Jean Luc, what OS & settings are you using in IBT?

I just tried it myself on default settings and standard. Your tests are taking like 66.5 seconds! All my mine averaged 34.2 seconds each.

Also, I just ran my Q6600 @ your settings, 3.0GHz and 1.275v and I am only running on air with a Thermalright 120 and one fan pushing air through it. My temps never even hit 60° C and my CPU has 20 more watts TDP than yours. Mine should be much hotter.
 
Jean Luc, it's the P35 board and the 4 sticks of ram that are causing the problems. Like has already been discussed, a P45 board will probably help you but the investment is probably not worth it for you.

This sadly is your answer. Even with a P45 I doubt that you'll see much over 3.2 stable.

G0? I wish I had a G0!

Those later G0 chips weren't really all too great for overclocking.

Try this test if it fails you can bet that it's MCH stability issue.

prime.png
 
This sadly is your answer. Even with a P45 I doubt that you'll see much over 3.2 stable.

I have 4 sticks w/P45 and can get 3.6GHz but mine is a B3 :(

With 4 sticks though my memory can't overclock well anymore. With only 2 sticks, my 1066's could hit 1333Mhz. With 4 sticks, I have to leave it @ 1066 or blend test fails all the time, even when cranking the voltage to ridiculous levels like 2.4V vdimm or cranking up the MCH core.

Those later G0 chips weren't really all too great for overclocking.

Try this test if it fails you can bet that it's MCH stability issue.

prime.png

I didn't know later G0s were not good. Captain Picard, did you try increasing your MCH voltage? Go nuts, bump it 0.2V. Default is like 1.2V IIRC. Try 1.4V. I have mine @ 1.3V. Get a fan on your northbridge though.
 
I'm using Vista Business x64, and I've been using the high stress test (2048 MB). At 3GHz, my tests do indeed take around 66 seconds,

@ 3GHz with 1.275V, I can get up to 72*C. I've got the stock corsair fan blowing into the radiator, and out the back of the case. The fan is set for variable speed through PWM, since I'm willing to sacrifice thermal performance for noise reduction.

At 2.66GHz with 1.200V, I top out at 62*C, with an average time of ~75 seconds for the High stress level test.

I also have a copper enzotech NB heatsink with a 40mm fan blowing into it, so the NB temps will probably be under control if I decide to add 0.2v (already have + 0.1 to MCH and FSB). I may try it.
 
Last edited:
Sounds like your CPU is throttling. TM2 uses the multi to reduce speed when the CPU is hot, hence the drop to 6x multi. When you disable TM2, TM1 should still be enabled. TM1 uses duty cycle throttling.

Check throttling with something like throttlestop. Check Tjmax is set correctly for your temperature monitoring.
 
I'm using Vista Business x64, and I've been using the high stress test (2048 MB). At 3GHz, my tests do indeed take around 66 seconds,

@ 3GHz with 1.275V, I can get up to 72*C. I've got the stock corsair fan blowing into the radiator, and out the back of the case. The fan is set for variable speed through PWM, since I'm willing to sacrifice thermal performance for noise reduction.

At 2.66GHz with 1.200V, I top out at 62*C, with an average time of ~75 seconds for the High stress level test.

I also have a copper enzotech NB heatsink with a 40mm fan blowing into it, so the NB temps will probably be under control if I decide to add 0.2v (already have + 0.1 to MCH and FSB). I may try it.

I could be wrong, but I believe the H50 performs significantly better when drawing cool air into the case. Provided your case airflow doesn't completely blow. Might help temps a bit if you switch it around, though that doesn't necessarily seem to be the problem with your OC.
 
I could be wrong, but I believe the H50 performs significantly better when drawing cool air into the case. Provided your case airflow doesn't completely blow. Might help temps a bit if you switch it around, though that doesn't necessarily seem to be the problem with your OC.

That's correct as far as most cases that I have seen. Performance is much better when pulling in directly from the back/fresh source than from using warm in-case air.
 
OP i think there could be something wrong with your h50.

i run mine in push/pull with 2 1200 rpm antec fans blowing out.

with my q6600 (B3) at 3.2 my temps are way lower then yours

Untitled-1.jpg


did you forget to plug the pump in or something?
 
About an hour ago, I switched the fan to pulling air through the radiator into the case. The temperature of all the components in the case, CPU included, rose significantly. I should have figured that this would happen, as my PC sits in a desk cubby, and the only direction to draw fresh air is through the front of the case, not the rear. I've put the fan back on the radiator, blowing air through it and out the rear again. Yes, the pump is plugged in.

I use core temp to monitor CPU temperature.

The friend I bought the CPU from said to me a little while back, "It's not necessarily a worthless OC if there's an error in IBT." However, I don't like the idea of my CPU delivering any sort of error or abnormal behavior regardless of the program in question.

I'm not sure what else to try at the moment, I might slap another 120mm fan onto the radiator and see what happens to my temperatures.

If anyone comes up with something, I'd be glad to hear it. Thanks for checking it out so far.
 
and when you IBT what are you seeing for temps?

i have b3 at 3.2 1.325v and my temps are in the upper 40's (using the same cooler as you).

i think your cooler is defective or it isnt properly installed.

have you tried reseating it?

you should use hardwaremonitor (http://www.cpuid.com/downloads/hwmonitor/1.16-64bit.zip) to make sure your pump is running at the correct speed. (i wouldnt trust the temps from hardware monitor)

Captain, I'm not sure your cooler is defective but you never know. You are using it in a configuration that isn't optimal, however given how you store you computer (in a cubby) this might actually be the best you can hope for. I'd definitely try reseating, and maybe invest in some more case cooling if it isn't good already (this might allow you to switch the fans to intake and get better temps). Hardwaremonitor would be good for pump speed as well.
 
So for kicks, I bumped the CPU up to 9 x 378 @ 1.350V in bios. This is what happened according to throttlestop. I'm not sure which of the system fan RPMs correspond to the pump, but maybe one of you can pick that out. I've got all the mobo headers plugged with fans.

blarg.jpg
 
For the Gigabyte P35 DS3L, the latest bios is F9c, which I'm already running. I'm not sure where I'd begin looking for a guide as to which bios versions are the best for OCing on this board. Maybe XS forums? Anyway, core 0 and 1 are definitely throttling. They're definitely hot, but not outrageously hot (compared to the stock heatsink, anway). As for the waterblock, I had assumed it was optimally mounted since under normal circumstances, the temperature distribution is very close across all the cores. Right now, the block is positioned so that the tubes are at the bottom of the block, parallel to the bottom of the CPU socket.
 
Can you try running Prime 95 - Small FFTs? That's the best test to equally load all 4 cores. With IBT / Linpack testing there are times when the cores are not fully loaded but it doesn't usually look like what you are showing.

Don't check Clock Modulation or Chipset Modulation when testing. This will allow ThrottleStop to monitor what's going on without trying to change anything. It looks like clock modulation is being used on the first two cores but it's hard to see what's going on when ThrottleStop is trying to force that to 100% and prevent throttling. Also uncheck the multiplier box when testing. This should make it easier to see exactly what's going on. Run a ThrottleStop log file and post it too when running IBT. You might want to try LinX which is a similar front end for Linpack testing.

The DTS column tells you how far the CPU is away from thermal throttling. You still have lots of head room so I'm not sure why it is slowing down internally like this but if you run a few more tests, I think this will start to make more sense.

Edit: ThrottleStop monitors the two most widely used types of clock modulation but I think there is also a third version that can be used to internally slow down a CPU. You could try using RMClock to see if you can disable this third type of throttling but I'm not 100% certain about this. RMClock might not support your system. It does funny things on my desktop Quad like when it locks two or the four cores at the minimum 6.0 multiplier when it exits. :(

Check with the ThrottleStop check marks turned off first. It might just be one of the regular types of modulation killing performance. If task manager shows 100% load and your C0% is 56% load then there's definitely a problem with internal throttling.
 
Last edited:
Back
Top